### [[2025]]年 - [[2025-06|06月]], [[2025-06-12|<]] [[第164天]] [[2025-06-14|>]] , 金曜日
---
## 記事
https://keyconcert.harmonicsh.com/
600/24000 * (11400+800) * 0.055+10
[X](https://x.com/bal_noraneko/status/1596361513916600320)
23248+2111+3850+1800
31009 * 0.05
2960+3837+3600+1036+1036+1036+2173+1036+3600+2145+2145+2109+2298
4450+7180
11630 * 0.055+10
#### 出账
##### 货款
###### amex
Oamex:: 39411
4071+2640+9260+4100+6930+12410
###### tongyi
Otongyi:: 19485
[[2025-05-30]] tower消费加算
5280+3259
8539 * 0.9
2000单独记
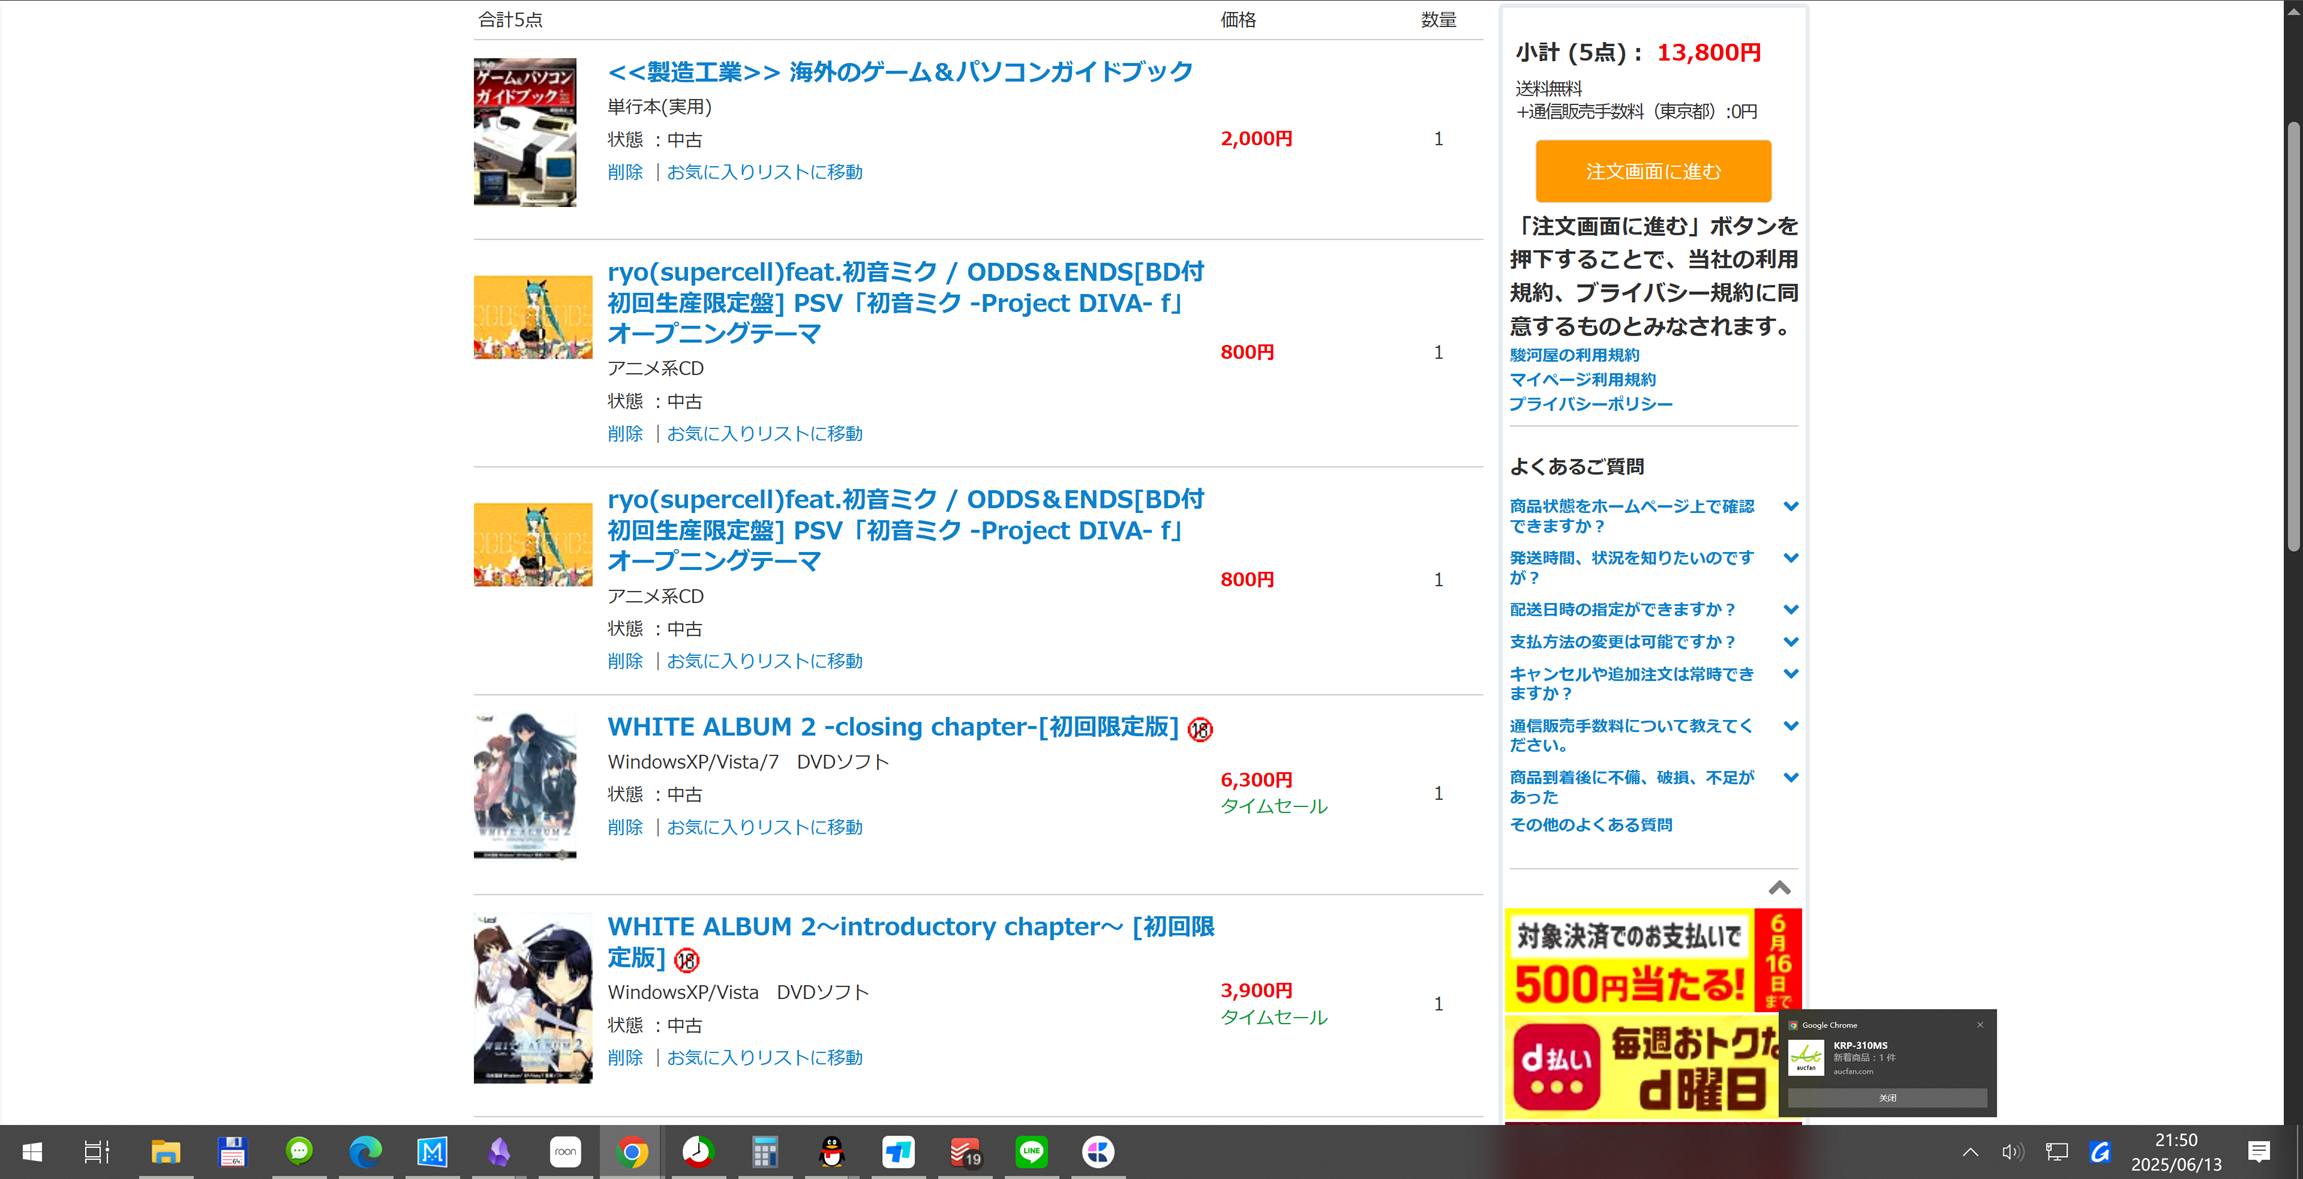
800+800+6300+3900
11800+7685
odd之后检品
oTONGYIamex:: 36980
###### nashiga
Onashiga::
##### 消耗
###### tongyi
Utongyi::
###### nashiga
Unashiga::
##### 工资
###### tongyi
Stongyi:: 7800
1600
gs单子6000
1600+6000+200
###### nashiga
Snashiga::
#### 入账
###### tongyi
Inashiga::
Itongyi:: 157
157
```dataviewjs
const d = dv.current()
// === 原始字段 ===
const amex = d.Oamex || 0
const tongyi = d.Otongyi || 0
const nashiga = d.Onashiga || 0
const use_tongyi = d.Utongyi || 0
const use_nashiga = d.Unashiga || 0
const sal_tongyi = d.Stongyi || 0
const sal_nashiga = d.Snashiga || 0
// === 汇总值 ===
const oOUTall = amex + tongyi + nashiga
const oUSEall = use_tongyi + use_nashiga
const oSALall = sal_tongyi + sal_nashiga
const oALL = oOUTall + oUSEall + oSALall
// === Chart 配置 ===
const chartData = {
type: 'doughnut',
data: {
labels: [
'总货款',
'总消耗',
'总工资'
],
datasets: [
{
label: '总支出分类',
data: [oOUTall, oUSEall, oSALall],
backgroundColor: [
'rgba(75, 192, 192, 0.6)', // OUT
'rgba(153, 102, 255, 0.6)', // USE
'rgba(255, 159, 64, 0.6)' // SAL
],
borderColor: [
'rgba(75, 192, 192, 1)',
'rgba(153, 102, 255, 1)',
'rgba(255, 159, 64, 1)'
],
borderWidth: 1
}
]
},
options: {
responsive: true,
cutout: '50%',
plugins: {
legend: {
position: 'bottom'
},
tooltip: {
enabled: true
},
centerText: {
display: true,
text: `总支出:¥${oALL.toLocaleString()}`
}
}
},
plugins: [
{
id: 'centerText',
beforeDraw: function (chart) {
const width = chart.width;
const height = chart.height;
const ctx = chart.ctx;
ctx.restore();
const fontSize = (height / 150).toFixed(2);
ctx.font = `${fontSize}em sans-serif`;
ctx.textBaseline = 'middle';
const text = chart.options.plugins.centerText.text;
const textX = Math.round((width - ctx.measureText(text).width) / 2);
const textY = height / 2;
ctx.fillText(text, textX, textY);
ctx.save();
}
}
]
}
window.renderChart(chartData, this.container)
```
---
# memos